Grafana Plugin
Description
Display your activity summary in a Grafana Dashboard.
If you are really into dashboards, nothing beats Grafana. Lots of plugins are available, and now there is one for your activity summary.
At the moment, the plugin has been submitted for approval, but review is pending.
If you want to use the unsigned version, you can check it out from the Github repo.
Note: Grafana has a bit of a learning curve, so this is for the technically minded.
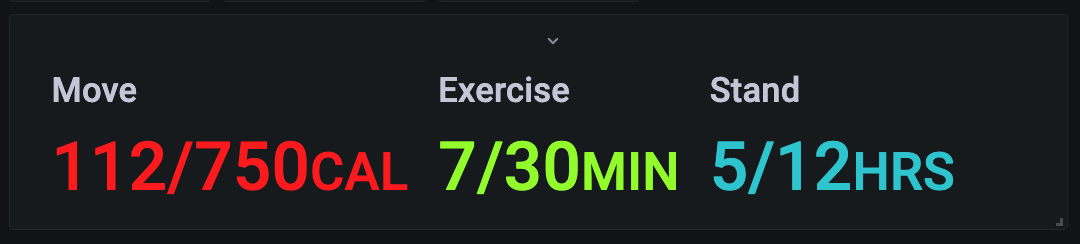
Preview
The extension will look something like this:
Installation
Note: As the plugin has not been approved, the installation is complicated and you must allow unsigned plugins.
You will need to download the plugin from the GitHub repo:
Then copy and uncompress the plugin on your Grafana server. Typically, the path that the uncompressed plugin should be copied to is:
/var/lib/grafana/plugins
Finally you will need to explicitly allow the plugin to be loaded, please see the parameter here:
Configuration
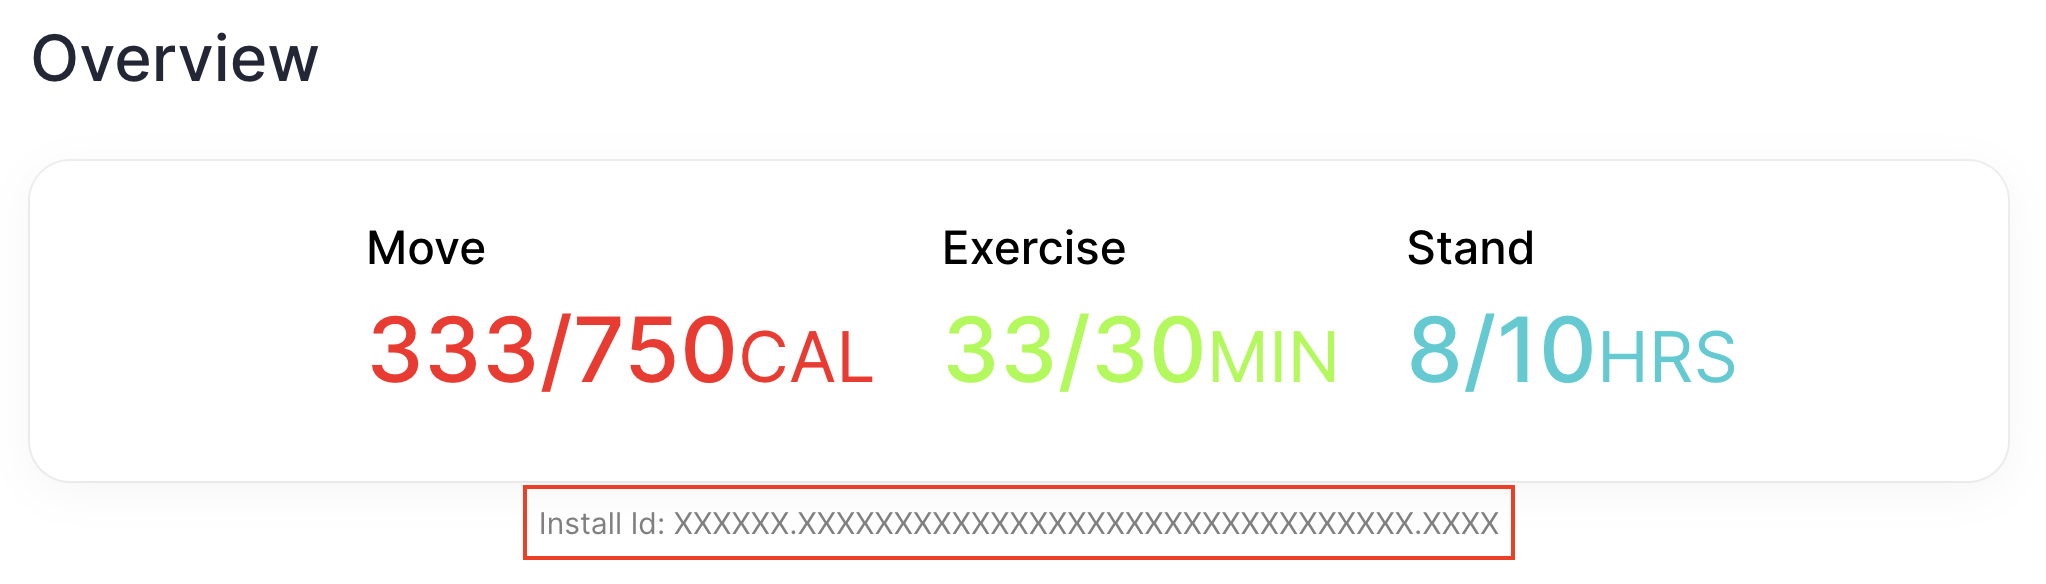
The only step is to configure your Install Id.
Sign in and by default you should be on the Dashboard, under the Overview activity display you should see the Install Id in grey.
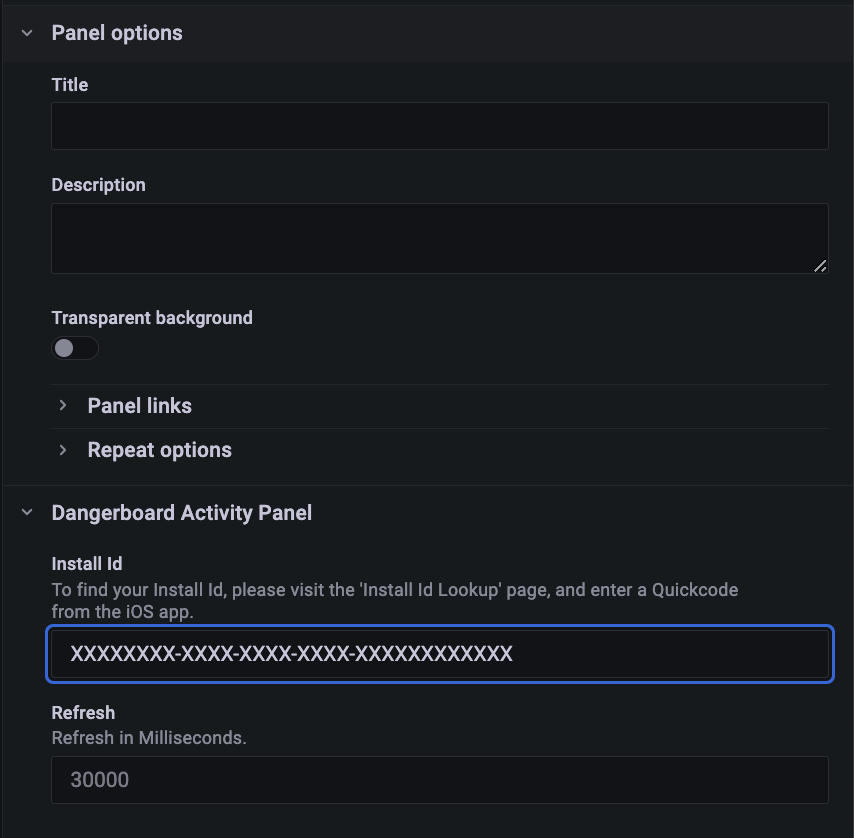
After adding the panel, editing the panel will allow you to configure the Install Id.
Click Save and then exit the edit screen.
Back on the dashboard you should see your changes.
All done! Congratulations, you have configured your Grafana plugin.